🔍 Introduction
In high-hazard industries such as oil & gas, petrochemicals, LNG, fertilizers, and chemicals, ensuring the safety of people, assets, and the environment is paramount. One of the most powerful tools to evaluate and mitigate risks in such environments is the Quantitative Risk Assessment (QRA).
This article provides a complete guide to QRA — its purpose, methodology, components, outputs, tools, case studies, and application — tailored for process safety engineers, project managers, HSE officers, and design consultants.
📊 What is QRA?
Quantitative Risk Assessment (QRA) is a structured, numerical approach to evaluate the risks associated with hazardous events (like toxic releases, fires, and explosions) in a facility.
It estimates the frequency and consequences of potential incidents and combines them to derive:
- Individual Risk (IR): Risk of fatality to a person at a specific location
- Societal Risk: Risk to a group of people (public, workers)
QRA supports safe facility design, emergency planning, regulatory compliance, and insurance analysis.
🧭 Objectives of QRA
- Identify Major Accident Hazards (MAHs)
- Estimate likelihood and impact of loss of containment (LOC) events
- Evaluate risk to humans and infrastructure
- Compare calculated risk with tolerability thresholds (ALARP, regulatory criteria)
- Guide layout decisions, occupied building siting, barrier design
- Support fire protection and mitigation system planning
Explore: List of Process Safety Studies
📝 Typical QRA Scope
- Hazard identification (e.g., HAZID, HAZOP)
- Initiating event frequency estimation
- Consequence modeling (toxic, fire, explosion)
- Risk estimation and contour plotting
- Societal risk (FN curve)
- Tolerability analysis
- Risk mitigation hierarchy and recommendations
🔬 QRA Methodology – Step-by-Step
Step 1: Data Collection and Hazard Identification
- Process design data (P&IDs, HMBs)
- Operating parameters (pressure, temp, compositions)
- Hazardous material inventories
- Past incident records
- HAZID/HAZOP studies
Step 2: Frequency Analysis
- Equipment failure rates (e.g., leaks, ruptures)
- Ignition probability
- Use of OREDA, Purple Book, or CCPS data
- Event Tree and Fault Tree Analysis
Step 3: Consequence Modeling
Model release and impact using tools such as:
- PHAST (jet fire, pool fire, VCE, dispersion)
- SAFETI (risk contour generation)
- ALOHA / EFFECTS (free or supplemental tools)
Common scenarios:
- Jet fire from flange leak
- BLEVE from pressurized LPG tank
- Flash fire from vapor cloud
- H₂S dispersion from acid gas line leak
Explore: What is PHAST Software? Basics for Engineers
Step 4: Risk Estimation
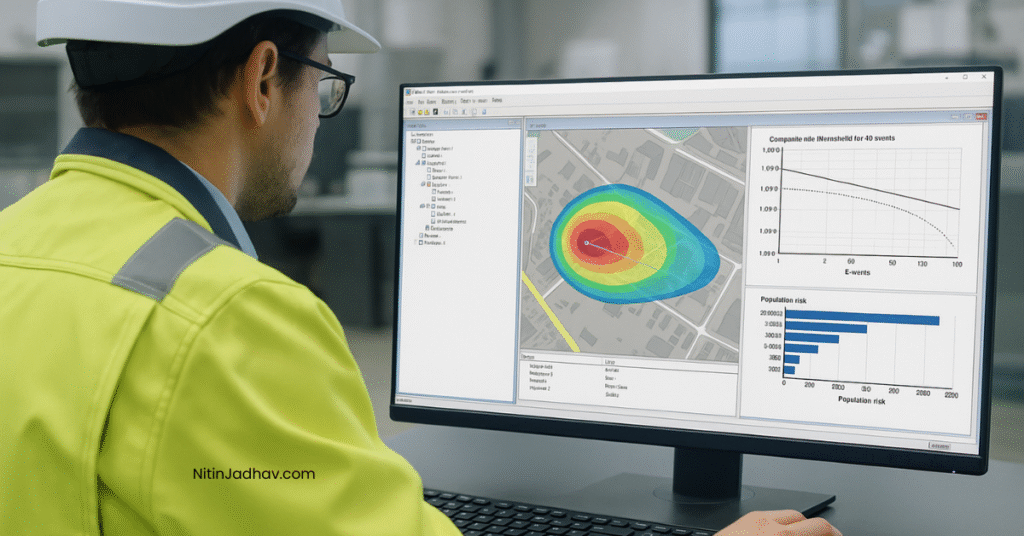
- Individual Risk: Plotted in risk contours (e.g., 1×10⁻⁴, 1×10⁻⁶)
- Societal Risk: Expressed as FN Curve (Frequency vs. Number of Fatalities)
Step 5: Risk Evaluation and Tolerability
- Compare results with:
- Regulatory criteria (e.g., OISD, UK HSE)
- Company-specific ALARP bands
- Apply Risk Acceptance Criteria (RAC) for decision-making
Step 6: Mitigation & Recommendations
- Plant re-layout
- Remote-operated valves (ROVs)
- Gas & flame detection improvements
- Deluge system enhancements
- Fireproofing, blast walls, passive fire protection (PFP)
📈 Key Outputs of a QRA
| Output | Description |
|---|---|
| Risk Contours | Geographic plot of individual risk levels |
| FN Curve | Cumulative risk to population |
| Event Tree/Fault Tree | Logic-based escalation of events |
| Scenario List | Top MAHs, frequencies, impacts |
| Risk Mitigation Table | Prioritized risk reduction measures |
🛠 Software Tools Used in QRA
| Software | Function |
|---|---|
| PHAST | Dispersion, fire & explosion modeling |
| SAFETI | Complete QRA with contour & FN curve generation |
| ALOHA | Free toxic gas dispersion modeling |
| EFFECTS | Fire/explosion consequence estimation |
| PHA Pro | Initial hazard analysis input |
🧩 QRA vs HAZOP vs LOPA
| Parameter | QRA | HAZOP | LOPA |
|---|---|---|---|
| Type | Fully Quantitative | Qualitative | Semi-Quantitative |
| Goal | Assess risk numerically | Identify deviations | Evaluate layers of protection |
| Output | Contours, FN curves | Deviation-based causes/effects | SIL determination |
| Software | PHAST, SAFETI | Worksheets | LOPA worksheets, Risk Matrix |
| Stage | FEED/Detailed Design | All stages | After HAZOP |
Explore: SIL vs LOPA – Key Differences
🧠 Real-World Case Study
📍 Project: Crude Oil Terminal QRA – Middle East
Scenario: Vapor cloud explosion from tank roof leak during nitrogen blanketing failure
Result: 1×10⁻⁵ risk contour exceeded admin building limit
Actions:
- Control room re-located 150m away
- Automatic isolation valves added
- IR reduced to 1×10⁻⁶, within tolerable threshold
📎 Regulatory & Industry Standards
- OISD-206: Risk analysis in Indian oil & gas facilities
- UK HSE Tolerability of Risk (TOR) Criteria
- CCPS Guidelines for Chemical Process Quantitative Risk Analysis
- API RP 752/753: Facility siting
- MoEF (India): Risk assessment in EIA reports
📌 When is QRA Required?
- New greenfield plants
- Plant modifications/expansions
- Siting of occupied buildings (per API 752/753)
- Near high-density public areas
- On regulatory or insurance request
Explore: Facility Siting Study – Importance & Methodology
❓ Frequently Asked Questions (FAQs)
Q1: Is QRA mandatory for all oil & gas projects?
A: It depends on project size, location, local regulations, and internal company policy. For hazardous chemical storage, it is often mandatory.
Q2: How long does a QRA study take?
A: Typically 4–10 weeks depending on plant complexity and number of scenarios.
Q3: Is PHAST sufficient for QRA?
A: PHAST is used for consequence modeling. For full QRA including FN curves and contours, SAFETI is preferred.
Q4: Can QRA results affect layout or budget?
A: Yes. High-risk findings can lead to re-layout, additional instrumentation, fireproofing, and higher capex.
✅ Summary
Quantitative Risk Assessment is a critical tool in the process safety lifecycle. It quantifies invisible threats and empowers designers, operators, and decision-makers with data-driven insights.
A well-conducted QRA ensures:
- Safer plant design
- Informed layout and siting
- Compliance with regulatory norms
- Protection of life, environment, and investment
Mastering QRA is an essential skill for every safety-conscious engineer.
🔗 Internal Links for Further Learning
Stay updated with practical engineering guides, free tools, and calculators at NitinJadhav.com.