Introduction
In high-risk industries like oil & gas, petrochemicals, pharmaceuticals, and energy, understanding the full scope of a potential hazardous event is crucial. It’s not just about identifying what can go wrong but also how, why, and what can be done to prevent or mitigate it. One of the most effective visual tools to achieve this is the Bow Tie Method.
The Bow Tie (BT) method is a qualitative risk assessment technique used to evaluate and manage risks by identifying the threats leading to an undesired event and the consequences that may result. Its strength lies in its ability to graphically represent causal pathways and controls in a simple, understandable manner that aligns both technical and non-technical stakeholders.
Originating after the 1988 Piper Alpha Disaster, this method has since become a staple in the development of Safety Cases and Operational Risk Management.
Historical Context
The Piper Alpha offshore platform explosion in the North Sea was one of the worst disasters in the history of the oil & gas industry. It exposed not only the technical shortcomings but also the organizational and communication failures in managing major hazards.
Post-incident investigations and regulatory reforms emphasized the need for better risk visualization, leading to the adoption of structured tools like Bow Tie diagrams in Safety Case documentation in the UK, Australia, and later globally.
What is a Bow Tie Diagram?
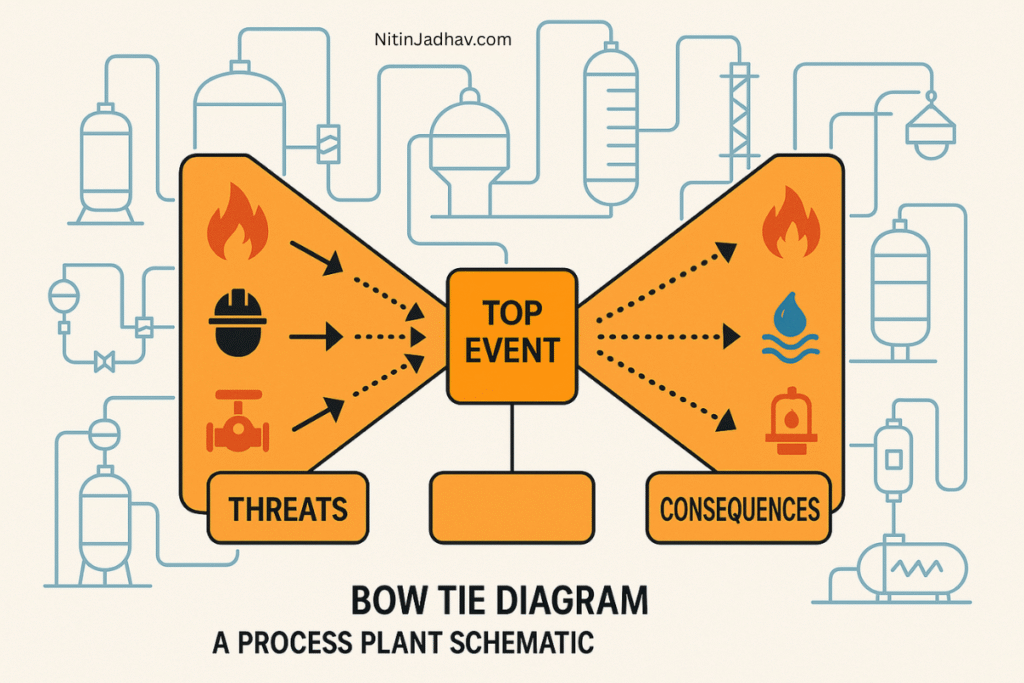
A Bow Tie diagram maps out the complete cause-to-consequence pathway of a hazardous event (Top Event). It consists of:
- Hazard
- Threats (causes)
- Top Event (loss of control)
- Consequences
- Preventive Barriers
- Mitigative/Recovery Barriers
The diagram resembles a bow tie, with the Top Event in the center, causes on the left, and consequences on the right.
THREATS ——> [PREVENTIVE BARRIERS] ——> [TOP EVENT] ——> [MITIGATIVE BARRIERS] ——> CONSEQUENCESExample:
- Hazard: Presence of flammable gas in a process plant
- Top Event: Loss of Containment (LOC)
- Threats: Corrosion, high pressure, human error
- Consequences: Explosion, injuries, production loss
- Prevention Barriers: Pressure control system, inspections, operator training
- Mitigation Barriers: Gas detectors, ESD system, fire suppression, ERDMP
Step-by-Step Bow Tie Development
Step 1: Define the Hazard and Top Event
- What energy or chemical/material poses the threat?
- What is the point of loss of control?
- Define boundaries (process unit, utility system, equipment)
Step 2: Identify Threats
- Use HAZOP, FMEA, and incident history
- Involve operations, engineering, and safety personnel
Step 3: Map Consequences
- Environmental, human, asset, reputation
- Short-term and long-term impacts
Step 4: Identify Barriers
Barriers must be:
- Independent
- Effective
- Auditable
- Assigned an owner
Step 5: Verify Barrier Integrity
- Do barriers degrade over time?
- Are they maintained/tested?
- What is the probability of failure on demand (PFD)?
Step 6: Assign Responsibilities
- Barrier owner
- Testing frequency
- Performance indicators (KPIs)
Step 7: Validate and Review
- Cross-check against LOPA and HAZOP
- Conduct peer reviews
- Integrate into Safety Management System (SMS)
Key Elements Explained
Hazard
Source of danger that could cause harm. Examples:
- Flammable liquids
- Toxic gases
- High pressure steam
Top Event
The point at which control is lost. Examples:
- Leak
- Equipment rupture
- Explosion
Threats
Initiating events that could lead to the top event:
- Human error
- Equipment failure
- Instrumentation fault
- External impact
Consequences
Results if the top event is not contained:
- Fire
- Explosion
- Toxic exposure
- Financial and reputational loss
Prevention Barriers
Controls that prevent the threat from leading to the top event:
- BPCS
- Interlocks
- SOPs
- Condition monitoring
Recovery Barriers
Controls that minimize the consequences:
- Gas detectors
- Firewater systems
- Emergency shutdown
- ERDMP and evacuation plans
Detailed Example: Refinery Gas Leak Scenario
Hazard:
Flammable hydrocarbons in a gas line
Top Event:
Loss of containment due to corrosion
Threats:
- Corrosion of underground pipeline
- Overpressure in line
- Valve left open
Prevention Barriers:
- Corrosion inhibitor injection
- Pressure safety valves
- Operator checklist (SOP)
- Leak detection system
Consequences:
- Gas cloud formation
- Ignition – explosion
- Toxic exposure
- Asset damage
Recovery Barriers:
- Fixed gas detectors
- ESD system
- Deluge system
- Emergency evacuation & firefighting
Residual Risk:
- Compared against risk matrix
- Additional IPLs added if unacceptable
Integration with LOPA, HAZOP & SIL
Bow Tie diagrams work alongside other tools:
- HAZOP: Identifies deviations
- LOPA: Provides semi-quantitative risk ranking
- SIL: Determines reliability requirements for Safety Instrumented Functions
- FTA (Fault Tree Analysis): Used for complex event logic
Common Mistakes in Bow Tie Development
- Vague Barriers: “Operator vigilance” is not a measurable barrier.
- Too Many Threats: Should be grouped logically.
- Missing Assignments: Barriers must have responsible persons.
- No Follow-up: Bow Tie must be part of continuous improvement.
- Poor Integration: Not linked to PTW, audits, training, or CMMS.
Real-World Use Cases
| Industry | Application |
|---|---|
| Oil & Gas | Loss of containment, fire/explosion scenarios |
| Chemical | Toxic releases, runaway reactions |
| LNG Terminals | Overpressure, cryogenic leaks |
| Offshore Platforms | Equipment collisions, H2S leaks |
| Power Plants | Steam turbine overspeed, fire in cable tunnels |
Bow Tie Software Tools
| Tool | Features |
| BowTieXP | Widely used, visual interface, audit-ready |
| CGE Risk Barrier Management | Links Bow Tie to performance indicators |
| BowTie Pro | Integrates with LOPA, audits, training |
| Risk Management Toolbox | Template-driven tool for multiple hazard studies |
Auditing and Barrier Management
A Bow Tie diagram is only as good as its implementation. Use these methods:
- Barrier Health Checks (monthly/quarterly)
- Visual status dashboards
- Training programs for each barrier
- KPI reporting to leadership
- Bow Tie Workshops with operations
Compliance and Regulatory Acceptance
| Standard | Application |
| UK HSE Safety Case Regs | Offshore Bow Ties mandatory |
| IEC 61511 | Barrier design and SIL determination |
| OSHA PSM | Recognized as best practice |
| COMAH (UK) | For Major Accident Hazard facilities |
| CCPS Guidelines | Advocated for risk communication |
Conclusion
The Bow Tie method is more than a diagram — it’s a strategy. In complex, high-hazard environments, it brings transparency, accountability, and control to safety management. It bridges the gap between technical assessments and frontline operations, ensuring that everyone understands how risks are being controlled.
When used correctly, Bow Ties are not just visual aids; they become living documents embedded in the safety culture of the organization.